Fast, Reliable Serverless: From 50 minutes to 50 seconds of downtime a year on AWS
Introduction
At Runa, we’re always striving to build the most performant products possible. I work on the Ledger team, a sub-team of engineering. Our focus is to enable each engineering team to transfer money with speed, accuracy, and ease.
Our approach to solving this problem is to create an interface over our core ledger. This prevents our other teams from getting bogged down with the complexities of this source of truth. This has allowed them to move with speed and efficiency while keeping the core ledger accurate and intact.
We achieve this through a set of APIs. They make up the Payment Intents service. In simple terms, they are like your bank’s concept of authorizing and settling a transaction.
This service is integral to our platform’s functionality, as fundamentally, the purpose of Runa is to move value with ease. Two key requirements, besides correctness, were high reliability (> 99.999%) and a fast response time.
We are plagued by what we call “phantom” requests. These are requests that AWS API Gateway receives, but never reach the resource, or return. AWS API Gateway has an SLA of just 99.95%, meaning that for a large volume endpoint, you are almost guaranteed to have requests getting lost in the network.
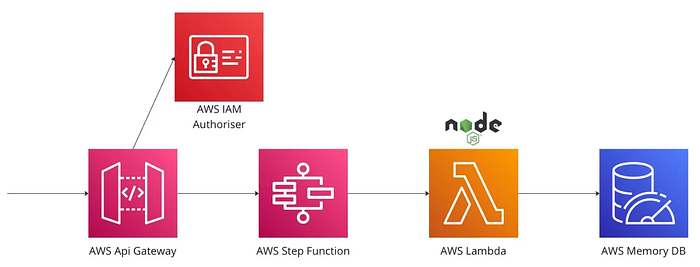
Below is a high level diagram of our architectural components. We often see the request from the API Gateway never reaching the Step Function, resulting in a timed-out request.

For an example of how the various SLA’s of AWS components can be compounded, see this post:Yan Cui — Compounding SLA’s
We used the below methodologies to take our API’s from 99.99% to 99.997% (99.999% after discounting the phantom errors out of our control) across 4 million requests.
Observability
Everything here starts with observability. Observability encompasses all of our performance metrics, logging and incident management.
We must use a data-driven, scientific approach to improve performance. Often, things thought to improve performance do not, and vice versa. Without these starting benchmarks you have no indication of whether your change has had a positive or negative effect.
At a high level, the two metrics we care about for these benchmarks arep95 response time, and your 4xx/5xx error code rate. The server error/timeout reasoning is obvious. However, 4xx errors have nuances. Is your authoriser failing? Is a resource that should exist missing? Are you hitting rate limits? These should be tackled on a case-by-case basis.
Now, what tools do we use to get our benchmarks?
Performance Testing
To get where you need to be, you need to know what your starting point is. To do this, you’ll need to implement a performance test; it will give you a baseline for the responsiveness and stability under certain workloads. It is the basis for evaluating any changes we have made, to see if it has actually improved things! Without this you could worsen response time, or increased errors, which only occur under certain workloads.
At Runa, we have usedArtilleryextensively to perform our load testing. It’s a very simple tool to set up and use. It enables you to achieve distributed load testing and provides you with a breakdown of the stats: response time, error codes etc.
It provides you with excellent visualisations of these metrics, and allows you to compare previous runs.

We used Artillery to measure all of the incremental changes to improve response time and reliability of our Payment Intents system. It highlighted multiple race condition issues and bottlenecks that we were not aware of until extensively testing.
Visualisation
Artillery gives us multiple snapshots of performance, but it does not show us a long term experience of our API users.
For this, at Runa, we have 2 options, Datadog, or AWS CloudWatch. We use Datadog for our longer term dashboards, but whilst troubleshooting ad-hoc issues or incidents, we lean on CloudWatch.
Summary
The two tools above should give you an idea of your system’s performance. Every system has its failure and slow points, and diagnosing them accurately can be a challenge. We’ll address this challenge in the next section.
Diagnosis Tooling
Tracing
Tracing gives us detailed execution diagnostics. It shows each component of an operation, from the gateway to the database. It can help you identify points of failure, slow components, and give you a better idea about your components’ topology.
Simply enable AWS X-Ray tracing on all your components; e.g Api Gateway resource, step function, lambda, etc.
With a few lines of configuration you can get a detailed map of the service, like below, with detailed execution durations.


You can then use trace map analytics to aggregate and analyze these durations, giving you a detailed view of each component’s performance. This is essential to ensure you get the full picture of the response time of the component, and not just one offs.

Logs Insights
If you use Lambda’s in your service, Logs Insights can help extract metrics that effect performance:
filter @type = “REPORT”
| stats
 count(@type) as countInvocations ,
 count(@initDuration) as countColdStarts ,     (count(@initDuration)/count(@type))*100 as percentageColdStarts,
 max(@initDuration) as maxColdStartTime,
 avg(@duration) as averageDuration,
 max(@duration) as maxDuration,
 min(@duration) as minDuration,
 avg(@maxMemoryUsed) as averageMemoryUsed,
 max(@memorySize) as memoryAllocated,  (avg(@maxMemoryUsed)/max(@memorySize))*100 as percentageMemoryUsed
by bin(1h) as timeFrame
You can generate insights like the maximum cold boot duration for your lambda over time, shown in the graph below. Combining this with the number of cold boots during that period provides a solid basis for understanding what affects your response time.

Summary
These tools help us figure out what’s slow or unreliable. With these baselines, we can take a scientific approach to tweak, test, and iterate on improvements.
Lessons Learned
Avoid lambda layers where possible
Sharing code with Lambda Layers has been advocated as a simple way to reduce the amount of code you’re deploying, and improve cold boot duration. This is a common fallacy that is explained in far more detail in thisarticle. You should read this separately, but the headlines are as follows:
- Lambda Layers do not improve or reduce cold boot duration
- The size of the code you load is the sole biggest factor in cold start time. It doesn’t matter if it’s in your lambda or a layer.
- Lambda layers can be a significant pain in the development process, as it means you will have “automagically” appearing dependencies in your lambda deployment. Debugging these is a PITA.
- Lambda layers do not support semantic versioning, just a LATEST and incremental versions. This means that if you make a major version change that affects multiple lambdas, all of them must be ready to handle this change at the same time.
- Dependency collisions are more likely using Lambda Layers.
It’s also worth noting that the Datadog extension, which enables APM traces, can increase cold boot duration, as discussed in this article:https://medium.com/@adtanasa/the-latency-overhead-of-application-performance-monitoring-with-aws-lambda-extensions-896582da9b51
Datadog has recently released an updated version of this layer, reducing the cold start impact of APM from 800ms to 400ms. However, this is still a significant delay, which is why the ledger team has chosen to use AWS Xray tracing for our critical low-latency lambdas where necessary.
Improve your cold start duration
Package size
The sole largest contributor to cold start duration is the size of your zip file. There is little way round decreasing your cold start duration without addressing this. The graph below shows the effect of package size on cold start durations.

Steps you can take to address this:
- Check for all non-essential dependencies and remove where possible.
- Split up your internal dependencies into smaller modules that can be selectively bundled.
- Use only the sub-parts of dependencies that you need, e.g
@aws-sdk→@aws-sdk/dynamodb/client. - Move any dependencies required for development/testing to dev-dependencies.
- Major improvements can be seen by using an adapted script that trims all non-essential files from node_modules. You can find a version of this script here:https://github.com/tuananh/node-prune/blob/develop/prune.sh. We used this script to reduce our node modules size from ~14mb to ~400kb.
We recommend usinghttps://pnpm.io/which ensures your lambdas are packaged only with what they need, reducing your bundle size dramatically.
These steps cut our P95 time by around 60ms for our critical endpoints — nearly a 20% reduction. This improvement came entirely from faster cold boot durations, which means bursty workloads are much less affected by cold starts. You can test these bursts of request volume in artillery by configuring different phases with quick ramp-up times.
Keep your lambda outside of VPCs where possible
VPCs are necessary for accessing certain resources like Redis and Postgres clusters. In your service, it might be tempting to put all your lambdas inside the VPC for easier development, but this approach increases your cold start duration.
Of course this is not always achievable, but be conscious of this!

Use AWS Lambda Power Tuning
https://github.com/alexcasalboni/aws-lambda-power-tuning
AWS Power Tuning is a tool that you can use to optimise the amount of memory that your Lambda should be configured to use.
Memory in AWS Lambda’s is your 1 stop shop lever for increasing CPU, RAM, and network priority. Up to a point, it can yield big performance gains. See the graph below for the results of one of our Lambdas. We saved 50ms (33%!) off of our initialisation duration for a single config variable.

The graph above shows a sweet spot at 4096 (circled). There, invocation time and cost converge.
In our case, it’s not worth going much higher. The effect on performance improvements is minimal — it’s suspected that higher memory takes longer for AWS to allocate to a point.
Also worth knowing, is that the cost graph isn’t strictly true. It does not account for the decreased execution duration, below is an example from AWS over 1000 executions.

Initialise clients outside of the Lambda handler
A crucial step in improving your Lambda’s performance is to reuse clients like Redis or DynamoDB between requests. To do this, make sure to initialize them outside of the Lambda handler.
This is because AWS Lambda uses a concept called “execution context” to improve performance. When a Lambda function is invoked, AWS Lambda creates an execution context to run the function. This context is maintained for some time in anticipation of another function invocation.
For example, the simple change below saved us 80ms off our p95 response time for this endpoint.

This change will yield a small increase in your initialisation duration the first time a Lambda is booted, but the subsequent requests will benefit greatly.
Favour direct integrations over generic calls from code
Where possible, using a step function direct integration is preferred, rather than integrating via Lambda code & boto/aws-sdk. This approach reduces latency and the duration of Lambda invocations, ultimately decreasing overall cost.
For simple endpoints, using a Lambda function is often sufficient. However, when you need to orchestrate multiple steps, components, and service calls, it’s highly recommended to wrap your operation in a Step Function. AWS Step Functions give you out of the box observability, flexibility in extending your service, and, most importantly, leading on to the next point: native error handling andretries.
Retry, retry, retry
This was learnt the hard way by the Ledger team, when we first released an early version of our Payment Intents service, we were being paged more than 20 times per week. All points of failure that could fail, did. Even retrieving secrets from SecretsManager!
To fix this, the team had to put in a lot of effort, adding retries to everything and making all calls that create a resource idempotent. As mentioned earlier, for instance, API Gateway’s SLA is only 99.95%, but since our client teams need to meet their 4 9’s SLOs, we had to achieve at least 5 9’s.
This means that any operation involving a network call — whether it’s an API Gateway invocation, retrieving secrets, or publishing events — must be assumed to potentially fail, so you need to catch and retry it. Additionally, your services should be designed to be idempotent, allowing reliant API consumers to safely retry as well.
Using this methodology, we went from more than 20 errors a week, down to 0 errors over a 10 day period.
Step Function retries are much more robust and easier to implement than building these features into custom Lambda functions. We highly recommend this approach for a more reliable and observable service.
Our biggest takeaway from earlier versions was the importance of this approach, and we’ve made heavy use of it in our latest implementation to handle flaky network requests. Anywhere there’s a network call, it can break, and it will.
When setting up retries, be thoughtful about your configuration. Consider what you’re retrying and what you’re hitting. For example, we retry Redis operations five times in five milliseconds, but when dealing with legacy systems, we use a more gradual approach with exponential backoff. Each case is unique.
Can you do it asynchronously?
We can’t avoid the fact that our operations are slow and take a long time due to various reasons, such as relying on legacy services, third-party processors, or other slow dependencies.
Since these operations are critical but not time-sensitive and are required to generate a response to the client, they should be completed asynchronously. This can be done by invoking a step function asynchronously or using one of the many message brokers offered by AWS. You can find a comparison of their latencies for put and delivery here:https://lucvandonkersgoed.com/2022/09/06/serverless-messaging-latency-compared/
The key is to keep critical operations simple and do as little work as possible before sending a response to the client.
By taking slow operations out of the critical path, we’ve significantly reduced our P95 latencies.
Use the correct component to store your configuration
This article provides more in-depth information than I will cover here:https://aaronstuyvenberg.com/posts/ultimate-lambda-secrets-guide
In summary, for configurations that don’t require frequent updates and aren’t sensitive, store them in environment variables instead of Parameter Store — it’s much faster and encrypted at rest.
For critical secrets that need quick retrieval, use Secrets Manager instead of Parameter Store secure strings.
Also, remember to use the retry policy mentioned earlier when fetching secrets in a Step Function. If you’re using secrets in a Lambda, consider retrieving them during initialization, outside of the handler, like we did with clients.
A note on provisioned concurrency
Provisioned concurrency, in simple terms, means having a set number of Lambdas always running, which avoids the cost of cold starts.
When configuring your Lambda, it can be tempting to use provisioned concurrency as the default option. However, this can be very expensive. For instance, a 4096mb Lambda with a provisioned concurrency of 10 would cost over £300 a month. If you have multiple Lambdas, the costs add up quickly.
If your Lambdas are serving a high volume of requests, you don’t really need provisioned concurrency — Lambdas stay active after the current execution for anunspecifiedamount of time, however with a high throughput you will almost definitely end up re-using already warm instances.
The CloudWatch metricProvisionedConcurrencySpilloverInvocationscan be a good indicator of whether your provisioned concurrency is not being used and you could afford to scale it back.
Where possible use resource based IAM policies
Using resource-based IAM policies instead of identity/role-based ones can significantly reduce the response time between your API gateway and compute resource, such as Step Functions or Lambdas. This simple change can produce dramatic results. For more details, see this excellent article:https://medium.com/@lancers/low-hanging-fruit-to-reduce-api-gateway-to-lambda-latency-8109451e44d6
Summary
- Start with your benchmarks, you don’t know if you’ve improved things if you don’t know where you started.
- Tracing gives you highly detailed diagnostic capabilities.
- Logs insights can give you deeper insight to your Lambda init, cold start durations, and memory usage.
- Think about your overall Lambda size & whether it’s in a due to the impact on response time.
- Initialise clients so that they can be reused across requests.
- Step functions orchestrate even small operations, thanks to their retry and direct integration capabilities.
- If it can be async, it should be async.
- Use resource based IAM policies.
Recommended resources
- AWS Well Architected — build secure, high-performing, resilient, and efficient infrastructure:https://aws.amazon.com/architecture/well-architected/?wa-lens-whitepapers.sort-by=item.additionalFields.sortDate&wa-lens-whitepapers.sort-order=desc&wa-guidance-whitepapers.sort-by=item.additionalFields.sortDate&wa-guidance-whitepapers.sort-order=desc
- Use direct service integrations to optimize your architecture:https://aws.amazon.com/blogs/architecture/use-direct-service-integrations-to-optimize-your-architecture/
- What are lambda extensions and why do they matter?https://lumigo.io/blog/aws-lambda-extensions-what-are-they-and-why-do-they-matter/
- Cold start time analysis:https://medium.com/@r_smith/aws-lambda-memory-duration-and-cold-start-time-analysis-bfcd78d2e58a
- Improving Lambda cold starts:https://www.youtube.com/watch?v=IHFJ-0_3cXY
- Improve performance of services by avoiding unnecessary parameter retrieval:https://aaronstuyvenberg.com/posts/ultimate-lambda-secrets-guide
- Low hanging fruit to reduce AWS API Gateway Latency:https://medium.com/@lancers/low-hanging-fruit-to-reduce-api-gateway-to-lambda-latency-8109451e44d6